JacketFlap connects you to the work of more than 200,000 authors, illustrators, publishers and other creators of books for Children and Young Adults. The site is updated daily with information about every book, author, illustrator, and publisher in the children's / young adult book industry. Members include published authors and illustrators, librarians, agents, editors, publicists, booksellers, publishers and fans. Join now (it's free).
Login or Register for free to create your own customized page of blog posts from your favorite blogs. You can also add blogs by clicking the "Add to MyJacketFlap" links next to the blog name in each post.
Blog Posts by Tag
In the past 7 days
Blog Posts by Date
Click days in this calendar to see posts by day or month
Viewing: Blog Posts Tagged with: data, Most Recent at Top [Help]
Results 1 - 25 of 25
How to use this Page
You are viewing the most recent posts tagged with the words: data in the JacketFlap blog reader. What is a tag? Think of a tag as a keyword or category label. Tags can both help you find posts on JacketFlap.com as well as provide an easy way for you to "remember" and classify posts for later recall. Try adding a tag yourself by clicking "Add a tag" below a post's header. Scroll down through the list of Recent Posts in the left column and click on a post title that sounds interesting. You can view all posts from a specific blog by clicking the Blog name in the right column, or you can click a 'More Posts from this Blog' link in any individual post.
Initially, they had envisaged dozens of them: slim booklets that would handily summarize all of the important aspects of every parish in Ireland. It was the 1830s, and such a fantasy of comprehensive knowledge seemed within the grasp of the employees of the Ordnance Survey in Ireland.
My first degree was in mathematics, where I specialised in mathematical physics. That meant studying notions of mass, weight, length, time, and so on. After that, I took a master’s and a PhD in statistics. Those eventually led to me spending 11 years working at the Institute of Psychiatry in London, where the central disciplines were medicine and psychology. Like physics, both medicine and psychology are based on measurements.
How was information used before the age of Google? Cookbooks showed people how to make new dishes; instructions packed with disassembled toys carried the terror-filled message “some assembly required” and ensured hours of labor on Christmas Eve for millions of parents. Today, people “Google”, but this kind of information gathering has occurred since the seventeenth century.
Solving complex problems requires, among other things, gathering information, interpreting it, and drawing conclusions. Doing so, it is easy to tend to operate on the assumption that the more information, the better. However, we would be better advised to favor quality over quantity, leaving out peripheral information to focus on the critical one.
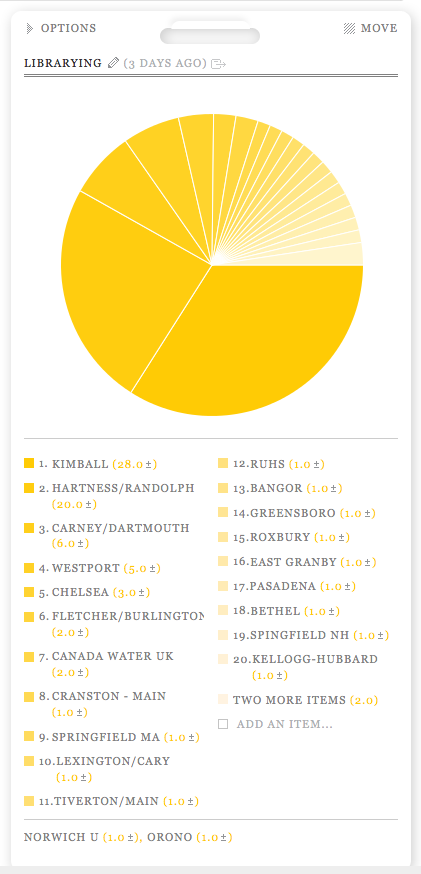
I went to twenty-two different libraries in seven states and one non-US country for eighty-two visits total. Did not intend this but it’s the same number of visits (though many fewer individual libraries) as last year. A few things influenced this: I did a lot less distance traveling this year but did a lot of work in local libraries, I also taught at a college where the library was a major hangout for me (thanks VTC Librarians, you are the best) and I worked a lot at my local public library. Here’s the short annotated list of what I was doing in libraries last year.
Kimball Library – my local public library, I work here and I am a patron here
Hartness at VTC – the best academic library anywhere near here and I worked at VTC this year
Carney Library UMass Dartmouth – probably my favorite library building of all time (still!)
Chelsea VT – helping with tech planning and visiting my friend Virgil
Westport MA – the library where I summer, trying to warm up to this library
Fletcher/Burlington VT – did consulting here this year and spent more time here
Canada Water UK – the closest public library to where my sister and I stayed in the UK, nice busy library
Cranston RI – visiting my friend ed, great renovations!
Springfield MA – did some work on the way to CT, neat building with a weird vibe
Cary Library, Lexington MA – did a talk earlier in the year, really nice place and great people
Tiverton RI Main Branch – lovely new building across from the Sip n Dip, great to see it!
RUHS Library – high school library in my town
Bangor ME – a neat classic library which is getting renovated
Greensboro VT – the quintessential Vermont library
Roxbury VT – taught an ipad class and saw how it’s been growing and changing
East Granby CT – killing time bfore a CT talk, this was a great place to get some R&R
Pasadena CA – there was a fancy event here for CLA and we had a nice time hanging out and talking to people in the theater.
Bethel VT – another place I taught an iPad class
Springfield NH – did some consulting for a library having growing pain challenges as they make decisions on whether to automate or not
Kellogg-Hubbard VT – went to a slide show given by a friend of mine, great to be here again.
Norwich University, Northfield VT – sropped by and saw their renovations and excellent art exhibits.
Orono ME – a pretty and small library
The bigger deal was really the Passport to Vermont Libraries project, a summer program put on by VLA which got hundreds of Vermonters visiting their local libraries and getting passport stamps and other fun adventures. I worked on this with a team of a few other people and it was a very successful program and I think a chunk of that was all of our enthusiasm for our library visits. So I didn’t get my further in my personal project, but professionally I helped get this idea to take off. If you just like library photos, I have more on Flickr.
In this podcast (click through to download or connect to online player), LeeAnna Mills, Former Legislative Chair and Past President of the Alabama School Library Association, librarian at Northside Middle School and District Library Media Coordinator for Tuscaloosa County Schools, discusses how you can use data to reach administrators, school board members, and legislators in support of library services for young people.
Wendy Stephens is a member of the YALSA Advocacy Resources Taskforce.
by Xavier Lancel Welcome to a new analysis of the Marvel sales. Reminder: I’m French, and that’s why I’m talking funny. Please address your complaints to my French-people-are-never-happy country. Reminder: the sales data referenced below is an estimate of sales to comics shops located in North America. American comics do get sold elsewhere in their original floppy […]
9 Comments on Marvel Month-to-Month Sales – July 2015: A Cavalcade of Mini-Wars!, last added: 8/25/2015
I love the Weirdworld comic. I was never a fan of the main character, nor am I too into the whole Secret Wars thing going on, but the art is fantastic and weird and I love it.
SCARCE- Xavier Lancel said, on 8/24/2015 1:10:00 PM
I really want to read it: Arkon has been such a jerk, I’m interested to see what was made of him. And of course, I wanna know the terrilbe fate of the Crystal warriors! I’m a huge fans of Saga of Crystar.
Zach said, on 8/24/2015 3:45:00 PM
What happened in Ant-Man #5 that made it jump so far in sales?
SCARCE- Xavier Lancel said, on 8/24/2015 4:02:00 PM
It looks like a special crate/box offer, or a special variant program at the same time than the release of the movie (like “buy 50 of those to 1 special variant cover for this”) but it had clearly nothing to do with readers taking a sudden interest into reading it.
V Wiley said, on 8/24/2015 5:27:00 PM
Hi Xavier! Great column, as usual. The phenominon that is Star Wars sales are outrageous. How would Marvel stack up against DC if they didn’t have the numbers from the Star Wrs titles?
Zach said, on 8/24/2015 8:56:00 PM
Thanks for the response, Xavier.
I do think the Star Wars books are sort of proof that a stable creative team can do a lot for a book/line of books. Darth Vader’s had a stable team, and while Cassaday didn’t stick around on the main book, I’m confident Immonen can deliver on a monthly basis. Sorta like Snyder/Capullo on Batman.
Nathan Aaron said, on 8/25/2015 7:26:00 AM
Why in the world would someone pay $25 dollars for a trade that they could have bought for $18 in floppies?!
THOR HC VOL.2 – 2,562 | 136p, $25
Only two months after the release of volume 1, here is volume 2, at a not-very-friendly price, and collecting very few things (only issue 6-8 and Annual 1). Sales are ok but its less than the first volume. Apparently, reviewers were not really happy with the small amount of stories collected.
Zach said, on 8/25/2015 7:52:00 AM
I mean, there is value in a trade that floppies don’t have (ease of display, ease of re-read, no ads), but also factor in that it’s easier to pay non-cover price for a trade. Amazon marks stuff down on the regular. But I agree, a bit lower a price would be preferable.
SCARCE- Xavier Lancel said, on 8/25/2015 8:30:00 AM
Remind yourself that it’s a HC: they are always way more expensive than their floppy counterpart.
In the 1960s British comedy radio show, Beyond Our Ken, an old codger would, in answer to various questions wheel out his catchphrase—in a weary, tremulous groan—‘Thirty Five Years!’ I was reminded of this today when I realized that it is exactly 35 years ago that my first book on privacy was published. And how the world has changed since then!
Introduction, from Michael Alvarez, co-editor of Political Analysis
Recently I asked Nathaniel Beck to write about his experiences with research replication. His essay, published on 24 August 2014 on the OUPblog, concluded with a brief discussion of a recent experience of his when he tried to obtain replication data from the authors of a recent study published in PNAS, on an experiment run on Facebook regarding social contagion. Since then the story of Neal’s efforts to obtain this replication material have taken a few interesting twists and turns, so I asked Neal to provide an update — because the lessons from his efforts to get the replication data from this PNAS study are useful for the continued discussion of research transparency in the social sciences.
After not hearing from Adam Kramer of Facebook, even after contacting PNAS, I persisted with both the editor of PNAS (Inder Verma, who was most kind) and with the NAS through “well connected” friends. (Getting replication data should not depend on knowing NAS members!). I was finally contacted by Adam Kramer, who offered that I could come out to Palo Alto to look at the replication data. Since Facebook did not offer to fly me out, I said no. I was then offered a chance to look at the replication files in the Facebook office 4 blocks from NYU, so I accepted. Let me stress that all dealings with Adam Kramer were highly cordial, and I assume that delays were due to Facebook higher ups who were dealing with the human subjects firestorm related to the Kramer piece.
When I got to the Facebook office I was asked to sign a standard non-disclosure agreement, which I dec. To my surprise this was not a problem, with the only consequence being that a security officer would have had to escort me to the bathroom. I then was put in a room with a Facebook secure notebook with the data and R-studio loaded; Adam Kramer was there to answer questions, and I was also joined by a security person and an external relations person. All were quite pleasant, and the security person and I could even discuss the disastrous season being suffered by Liverpool.
I was given a replication file which was a data frame which had approximately 700,000 rows (one for each respondent) and 7 columns containing the number of positive and negative words used by each respondent as well as the total word count of each respondent, percentages based on these numbers, experimental condition. and a variable which omitted some respondents for producing the tables. This is exactly the data frame that would have been put in an archive since it contained all the data needed to replicate the article. I also was given the R-code that produced every item in the article. I was allowed to do anything I wanted with that data, and I could copy the results into a file. That file was then checked by Facebook people and about two weeks later I received the entire file I created. All good, or at least as good as it is going to get.
Intel team inside Facebook data center. Intel Free Press. CC BY 2.0 via Wikimedia Commons.
The data frame I played with was based on aggregating user posts so each user had one row of data, regardless of the number of posts (and the data frame did not contain anything more than the total number of words posted). I can understand why Facebook did not want to give me the data frame, innocuous as it seemed; those who specialize in de-de-identifying private data and reverse engineering code are quite good these days, and I can surely understand Facebook’s reluctance to have this raw data out there. And I understand why they could not give me all the actual raw data, which included how feeds were changed and so forth; this is the secret sauce that they would not like reverse engineered.
I got what I wanted. I could see their code, could play with density plots to get a sense of words used, I could change the number of extreme points dropped, and I could have moved to a negative binomial instead of a Poisson. Satisfied, I left after about an hour; there are only so many things one can do with one experiment on two outcomes. I felt bad that Adam Kramer had to fly to New York, but I guess this is not so horrible. Had the data been more complicated I might have felt that I could not do everything I wanted, and running a replication with 3 other people in a room is not ideal (especially given my typing!).
My belief is that that PNAS and the authors could simply have had a different replication footnote. This would have said that the code used (about 5 lines of R, basically a call to a Poisson regression using GLM) is available at a dataverse. In addition, they could have noted that the GLM called used the data frame I described, with the summary statistics for that data frame. Readers could then see what was done, and I can see no reason for such a procedure to bother Facebook (though I do not speak for them). I also note a clear statement on a dataverse would have obviated the need for some discussion. Since bytes are cheap, the dataverse could also contain whatever policy statement Facebook has on replication data. This (IMHO) is much better than the “contact the authors for replication data” footnote that was published. It is obviously up to individual editors as to whether this is enough to satisfy replication standards, but at least it is better than the status quo.
What if I didn’t work four blocks from Astor Place? Fortunately I did not have to confront this horror. How many other offices does Facebook have? Would Adam Kramer have flown to Peoria? I batted this around, but I did most of the batting and the Facebook people mostly did no comment. So someone else will have to test this issue. But for me, the procedure worked. Obviously I am analyzing lots more proprietary data, and (IMHO) this is a good thing. So Facebook, et al., and journal editors and societies have many details to work out. But, based on this one experience, this can be done. So I close this with thanks to Adam Kramer (but do remind him that I have had auto-responders to email for quite while now).
On the more trivial issue of my own dataverse, I am happy to report that almost everything that was once on an a private ftp site is now on my Harvard dataverse. Some of this was already up because of various co-authors who always cared about replication. And on stuff that was not up, I was lucky to have a co-author like Jonathan Katz, who has many skills I do not possess (and is a bug on RCS and the like, which beats my “I have a few TB and the stuff is probably hidden there somewhere”). So everything is now on the dataverse, except for one data set that we were given for our 1995 APSR piece (and which Katz never had). Interestingly, I checked the original authors’ web sites (one no longer exists, one did not go back nearly that far) and failed to make contact with either author. Twenty years is a long time! So everyone should do both themselves and all of us a favor, and build the appropriate dataverse files contemporaneously with the work. Editors will demand this, but even with this coercion, this is just good practice. I was shocked (shocked) at how bad my own practice was.
Heading image: Wikimedia Foundation Servers-8055 24 by Victorgrigas. CC BY-SA 3.0 via Wikimedia Commons.
I went to thirty-six different libraries in seven states and two non-US countries for eighty visits total. A bunch more than last year, but some were just for ukulele practice or tech planning sessions at a friend’s library. Here’s the short annotated list of what I was doing in libraries last year. Top three libraries are: my local public, my local academic and my summer local.
Kimball – my local and also the place that hosts Ukulele Club
Hartness at VTC – the best academic library anywhere near here. Good hours, great place to hang out.
Carney – UMass Dartmouth – probably my favorite library building of all time
Chelsea VT – helping with tech planning, I go here often
Somerville West – did a talk and stopped by here another time. Lovely upstairs.
Goddard – did some VLA website work here
Fairfield/Millicent – One of the most amazing looking libraries in MA with some cool local lore
Aldrich/Barre – Went to a few meetings, my favorite local library renovation story
Mackinac Island MI – small and lovely with a great book sale and classic furniture
NYLP/SIBL – keep waiting for them to close this but they haven’t yet
Southworth/Dartmouth – they have a harpoon display here!
Pierson/Shelburne VT – went to a meeting, small with a great puzzle collection
St Ignace MI – killing time while stranded here, this is a great building where you wouldn’t expect it
Atwater/Montreal – my favorite Canadian library
British Library – got an awesome tour from Stella Wisdom
ULU Senate Hall UK – got a great tour from Simon who no longer works there
Rockingham VT – dropped off some things, stuck around to take a peek at this great place
Guilford UK – one of the smaller local publics, nice with a watch museum next door
Roxbury VT – helped with the automation project
Artizan St UK – community center, small and busy
John Harvard Library UK – had an odd section for Black Titles and a security guard
Sunderland MA – great place to pass the time en route to or from Amherst
Somerville MA – the other little library
Boxboro MA – wifi to check email if you are early to visit Mom
Boston Public – got a great tour by Tom Blake and saw some great stuff
Sun City AZ – hanging out while visiting Jim’s folks
UM – Duluth – Chihuly sculpture!
NYPL/Epiphany – I always love the huge staircase in here
Duluth MI – bizarre design but fun to hang out in
Westport MA – great DVD collection, sort of an odd place
Barbican UK – inside the funky Barbican, lots of great UK history books
Varnum, Cambridge VT – stopped by randomly, folks were so nice and friendly
Ashfield MA – gave a talk, enjoyed getting to see the place
NYPL/Kipp’s Bay – small and in need of renovation but warm and welcoming
City University, UK – stopped to check email en route to dinner, nice place, square dancing outside
Vicksburg MS – neat renovation, fun kids area
Did not get to as many Vermont libraries as I had wanted to as part of my 183 project. Working slowly on maybe getting a statewide 183 project up and running with other members of the VLA. Looking forward to another year of library visiting.
About half a century ago, an MIT professor set up a summer project for students to write a computer programme that can “see” or interpret objects in photographs. Why not! After all, seeing must be some smart manipulation of image data that can be implemented in an algorithm, and so should be a good practice for smart students. Decades passed, we still have not fully reached the aim of that summer student project, and a worldwide computer vision community has been born.
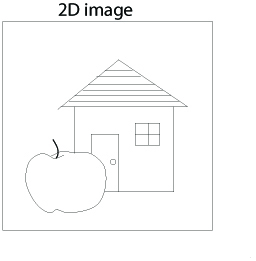
We think of being “smart” as including the intellectual ability to do advanced mathematics, complex computer programming, and similar feats. It was shocking to realise that this is often insufficient for recognising objects such as those in the following image.
Image credit: Fig 5.51 from Li Zhaoping,
Understanding Vision: Theory Models, and Data
Can you devise a computer code to “see” the apple from the black-and-white pixel values? A pre-school child could of course see the apple easily with her brain (using her eyes as cameras), despite lacking advanced maths or programming skills. It turns out that one of the most difficult issues is a chicken-and-egg problem: to see the apple it helps to first pick out the image pixels for this apple, and to pick out these pixels it helps to see the apple first.
A more recent shocking discovery about vision in our brain is that we are blind to almost everything in front of us. “What? I see things crystal-clearly in front of my eyes!” you may protest. However, can you quickly tell the difference between the following two images?
Image credit: Alyssa Dayan, 2013 Fig. 1.6 from Li Zhaoping Understanding Vision: Theory Models, and Data. Used with permission
It takes most people more than several seconds to see the (big) difference – but why so long? Our brain gives us the impression that we “have seen everything clearly”, and this impression is consistent with our ignorance of what we do not see. This makes us blind to our own blindness! How we survive in our world given our near-blindness is a long, and as yet incomplete, story, with a cast including powerful mechanisms of attention.
Being “smart” also includes the ability to use our conscious brain to reason and make logical deductions, using familiar rules and past experience. But what if most brain mechanisms for vision are subconscious and do not follow the rules or conform to the experience known to our conscious parts of the brain? Indeed, in humans, most of the brain areas responsible for visual processing are among the furthest from the frontal brain areas most responsible for our conscious thoughts and reasoning. No wonder the two examples above are so counter-intuitive! This explains why the most obvious near-blindness was discovered only a decade ago despite centuries of scientific investigation of vision.
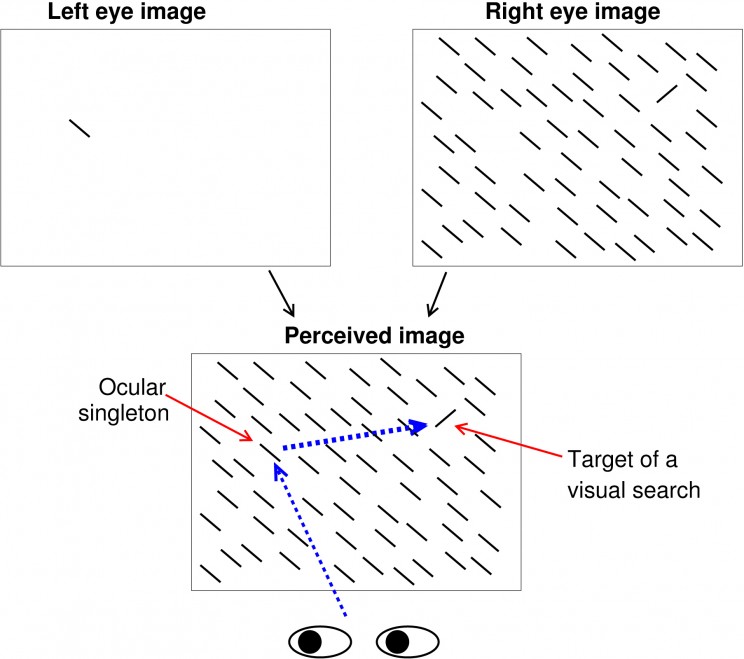
Another counter-intuitive finding, discovered only six years ago, is that our attention or gaze can be attracted by something we are blind to. In our experience, only objects that appear highly distinctive from their surroundings attract our gaze automatically. For example, a lone-red flower in a field of green leaves does so, except if we are colour-blind. Our impression that gaze capture occurs only to highly distinctive features turns out to be wrong. In the following figure, a viewer perceives an image which is a superposition of two images, one shown to each of the two eyes using the equivalent of spectacles for watching 3D movies.
Image credit: Fig 5.9 from Li Zhaoping,
Understanding Vision: Theory Models, and Data
To the viewer, it is as if the perceived image (containing only the bars but not the arrows) is shown simultaneously to both eyes. The uniquely tilted bar appears most distinctive from the background. In contrast, the ocular singleton appears identical to all the other background bars, i.e. we are blind to its distinctiveness. Nevertheless, the ocular singleton often attracts attention more strongly than the orientation singleton (so that the first gaze shift is more frequently directed to the ocular rather than the orientation singleton) even when the viewer is told to find the latter as soon as possible and ignore all distractions. This is as if this ocular singleton is uniquely coloured and distracting like the lone-red flower in a green field, except that we are “colour-blind” to it. Many vision scientists find this hard to believe without experiencing it themselves.
Are these counter-intuitive visual phenomena too alien to our “smart”, intuitive, and conscious brain to comprehend? In studying vision, are we like Earthlings trying to comprehend Martians? Landing on Mars rather than glimpsing it from afar can help the Earthlings. However, are the conscious parts of our brain too “smart” and too partial to “dumb” down suitably to the less conscious parts of our brain? Are we ill-equipped to understand vision because we are such “smart” visual animals possessing too many conscious pre-conceptions about vision? (At least we will be impartial in studying, say, electric sensing in electric fish.) Being aware of our difficulties is the first step to overcoming them – then we can truly be smart rather than smarting at our incompetence.
On 12 June 2014, hundreds of librarians and resource coordinators will gather in the historic spa town of Harrogate to attend the annual British and Irish Association of Law Librarians Conference (BIALL). The meeting provides an opportunity for delegates to convene and discuss the pressing issues in their field.
The theme of this year’s conference is “Data, Data, Everywhere.” The programme aims “to highlight the proliferation of ever-growing quantities of data, and the emerging technologies that have become available to exploit opportunities and manage the challenges” that this expansion has brought to the information management profession. The conference will offer a series of sessions on the use of social media, project management skills, and the use of e-books in the academic sector.
Here are some of the things we are most looking forward to at this year’s BIALL Conference:
Keynote address: “Data, Data, Everywhere” – Delivered by Phil Bradley, Information Specialist and Internet Consultant, this presentation will focus on big data, social media, and the increasingly changing role of websites
The Brave New World of Free, Open Data, and Open Access – Don’t miss out on this pre-conference seminar led by Karen Blakeman on 11 June. This useful session will provide tips on how to locate open access scholarly literature and find high quality information
Saturday Kitchen – This year BIALL is hosting a “Saturday Kitchen” event where exhibitors and suppliers, including OUP, will provide an overview of their current and planned projects or new services
Foreign, Comparative, and International Law Collections in the UK – This parallel session will focus on how best to use databases to find treaties and international and foreign law reports
If you have any spare time before, during, or after the conference take time to explore all that Harrogate and Yorkshire have to offer. From castle ruins and art galleries to World Heritage sites and fantastic scenery, there is much to do in this part of Northern England. Harrogate is also home to the famous Bettys Tearooms, which serve up a delicious selection of teas, cakes, and biscuits. The Tearooms are open until 9 p.m. daily, so there is plenty of time to pay a visit after a busy day in sessions.
If you are joining us at the conference don’t forget to visit the OUP stand to browse key titles and journals and pick up a copy of our latest catalogues. You will also have the opportunity to demo our fantastic suite of online research products.
Katherine Marshall is Senior Marketing Executive for Academic Law titles at Oxford University Press. Isabel Jones is Senior Marketing Executive for Commercial Law titles at Oxford University Press.
Oxford University Press is committed to developing outstanding resources to support students, scholars and practitioners in all areas of the law. Our practitioner programme continues to grow, with key texts in commercial law, arbitration and private international law, plus the innovative new ebook version of Blackstone’s Criminal Practice. We are also delighted to announce the new edition of the Max Planck Encyclopedia of Public International Law, one of the most trusted reference resources in international law. In addition to books, OUP publishes a wide range of law journals and online products. Follow our law teams on Twitter at @OUPIntLaw and @OUPCommLaw.
Subscribe to the OUPblog via email or RSS.
Subscribe to only law articles on the OUPblog via email or RSS.
Nowadays it appears impossible to open a newspaper or switch on the television without hearing about “big data”. Big data, it sometimes seems, will provide answers to all the world’s problems. Management consulting company McKinsey, for example, promises “a tremendous wave of innovation, productivity, and growth … all driven by big data”.
An alien observer visiting the Earth might think it represents a major scientific breakthrough. Google Trends shows references to the phrase bobbing along at about one per week until 2011, at which point there began a dramatic, steep, and almost linear increase in references to the phrase. It’s as if no one had thought of it until 2011. Which is odd because data mining, the technology of extracting valuable, useful, or interesting information from large data sets, has been around for some 20 years. And statistics, which lies at the heart of all of this, has been around as a formal discipline for a century or more.
Or perhaps it’s not so odd. If you look back to the beginning of data mining, you find a very similar media enthusiasm for the advances it was going to bring, the breakthroughs in understanding, the sudden discoveries, the deep insights. In fact it almost looks as if we have been here before. All of this leads one to suspect that there’s less to the big data enthusiasm than meets the eye. That it’s not so much a sudden change in our technical abilities as a sudden media recognition of what data scientists, and especially statisticians, are capable.
Of course, I’m not saying that the increasing size of data sets does not lead to promising new opportunities – though I would question whether it’s the “large” that really matters as much as the novelty of the data sets. The tremendous economic impact of GPS data (estimated to be $150-270bn per year), retail transaction data, or genomic and bioinformatics data arise not from the size of these data sets, but from the fact that they provide new kinds of information. And while it’s true that a massive mountain of data needed to be explored to detect the Higgs boson, the core aspect was the nature of the data rather than its amount.
Moreover, if I’m honest, I also have to admit that it’s not solely statistics which leads to the extraction of value from these massive data sets. Often it’s a combination of statistical inferential methods (e.g. determining an accurate geographical location from satellite signals) along with data manipulation algorithms for search, matching, sorting and so on. How these two aspects are balanced depends on the particular application. Locating a shop which stocks that out of print book is less of an inferential statistical problem and more of a search issue. Determining the riskiness of a company seeking a loan owes little to search but much to statistics.
Diagram of Total Information Awareness system designed by the Information Awareness Office
Some time after the phrase “data mining” hit the media, it suffered a backlash. Predictably enough, much of this was based around privacy concerns. A paradigmatic illustration was the Total Information Awareness project in the United States. Its basic aim was to search for suspicious behaviour patterns within vast amounts of personal data, to identify individuals likely to commit crimes, especially terrorist offences. It included data on web browsing, credit card transactions, driving licences, court records, passport details, and so on. After concerns were raised, it was suspended in 2003 (though it is claimed that the software continued to be used by various agencies). As will be evident from recent events, concerns about the security agencies monitoring of the public continues.
The key question is whether proponents of the huge potential of big data and its allied notion of open data are learning from the past. Recent media concern in the UK about merging of family doctor records with hospital records, leading to a six-month delay in the launch of the project, illustrates the danger. Properly informed debate about the promise and the risks is vital.
Technology is amoral — neither intrinsically moral nor immoral. Morality lies in the hands of those who wield it. This is as true of big data technology as it is of nuclear technology and biotechnology. It is abundantly clear — if only from the examples we have already seen — that massive data sets do hold substantial promise for enhancing the well-being of mankind, but we must be aware of the risks. A suitable balance must be struck.
It’s also important to note that the mere existence of huge data files is of itself of no benefit to anyone. For these data sets to be beneficial, it’s necessary to be able to use the data to build models, to estimate effect sizes, to determine if an observed effect should be regarded as mere chance variation, to be sure it’s not a data quality issue, and so on. That is, statistical skills are critical to making use of the big data resources. In just the same way that vast underground oil reserves were useless without the technology to turn them into motive power, so the vast collections of data are useless without the technology to analyse them. Or, as I sometimes put it, people don’t want data, what they want are answers. And statistics provides the tools for finding those answers.
The Very Short Introductions (VSI) series combines a small format with authoritative analysis and big ideas for hundreds of topic areas. Written by our expert authors, these books can change the way you think about the things that interest you and are the perfect introduction to subjects you previously knew nothing about. Grow your knowledge with OUPblog and the VSI series every Friday and like Very Short Introductions on Facebook. Subscribe to on Very Short Introductions articles on the OUPblog via email or RSS.
Subscribe to the OUPblog via email or RSS.
Subscribe to only mathematics articles on the OUPblog via email or RSS Image credit: Diagram of Total Information Awareness system designed by the Information Awareness Office. Public domain via Wikimedia Commons
Martin Luther King, Jr. was the legendary civil rights leader whose strong calls to end racial segregation and discrimination were central to many of the victories of the Civil Rights movement. Every January, the United States celebrates Martin Luther King, Jr. Day to honor the activist who made so many strides towards equality.
Let’s take a look at the demographics of the legendary man’s hometown then and now to see how it has (and has not) changed. King was born in 1929, so we’ll examine Census data from 1930, 1940, and the latest Census and American Community Survey data.
His boyhood home is now a historic site, situated at 450 Auburn Avenue Northeast, in Fulton County (part of Atlanta). In 1930, Fulton County had a population of 318,587 residents. A little over two thirds of the population was white (68.1 percent) and almost one third of the population was African American (31.9 percent). Today, the 920,581-member population split is nearly even at 44.5 percent white and 44.1 percent African American, according to 2010 Census data. Fulton’s population is more African American than the United States as a whole (12.6 percent), but not as as much as Atlanta (54.0 percent).
A closer look at 1940s Census data of the Atlanta area offers more detail about where the black and white populations lived. The following map shows the distribution of the black population in the Atlanta of King’s youth. Plainly, African Americans lived together, largely apart from whites.
African American Population in Fulton County, GA, and Surroundings, 1940 (click map to explore)
For comparison, the following map shows where the black population lives today. Now the black population has expanded in the metro area, but still seems to be quite segregated.
African American Population in Fulton County, GA, and Surroundings, 2010 (click map to explore)
Reflecting on a century after the end of slavery, King said in his famous “I Have a Dream” speech of 1963:
But one hundred years later, the Negro still is not free. One hundred years later, the life of the Negro is still sadly crippled by the manacles of segregation and the chains of discrimination. One hundred years later, the Negro lives on a lonely island of poverty in the midst of a vast ocean of material prosperity. One hundred years later, the Negro is still languished in the corners of American society and finds himself an exile in his own land. And so we’ve come here today to dramatize a shameful condition.
The quest for equal rights and freedoms made up part of a larger vision. In 1967, he spoke of aspiring for full equality at a speech at the Victory Baptist Church in Los Angeles:
Our struggle in the first phase was a struggle for decency. Now we are in the phase where there is a struggle for genuine equality. This is much more difficult. We aren’t merely struggling to integrate the lunch counter now. We’re struggling to get some money to be able to buy a hamburger or a steak when we get to the counter…
He went on to say that this would require a commitment of not only political initiative but also money: “It didn’t cost the nation one penny to integrate lunch counters. It didn’t cost the nation one penny to guarantee the right to vote. The problems that we are facing today will cost the nation billions of dollars.”
In 1968, King and other activists launched the Poor People’s Campaign, advocating for economic justice to address these imbalances in opportunity and resources. A few months later, he was assassinated.
We can look at different socioeconomic indicators to measure the country’s progress towards equality. According to 1940 Census data, more than a third (36.5 percent) of housing units in Fulton County where whites lived were owner occupied, compared to less than a seventh (14.0 percent) of the housing units where African Americans lived.
Today, home ownership increased for both groups, but the gap remains. Two thirds (66.6 percent) of white households are owner-occupied, compared to two fifths (41.7 percent) of all black households.
Home Ownership Comparison in Fulton, GA, by Race
Let’s examine other measures of equality to see examples of additional gaps.
The unemployment rate is nearly twice as high among African Americans (17.9 percent) compared to among whites nationwide (9.5 percent). That gap is even more pronounced in Fulton County, where the unemployment rate for whites is 7.7 percent, while the unemployment rate for African Americans is 20.4 percent.
The percent of those living below poverty is also higher in the black community (27.2 percent) than in the white community (12.5 percent). While both groups are better off in Fulton County than the rest of the US, the poverty rate gap is even larger (8.2 percent among whites and 26.6 percent among African Americans in Fulton).
Similarly, while both groups are better educated in Fulton County compared to the rest of the US, nearly two thirds (62.4 percent) of white adults in the county have BA degrees or more, while just one quarter (25.3 percent) of the black population have the same level of education. The college attainment gap is 11.6 percentage points nationwide, but 37.1 percentage points in Fulton County.
While much progress towards freedom and equality has been made since King’s time, chronic gaps persist, even in his own backyard. The data show that 50 years after the “I Have a Dream Speech,” equal opportunity and socioeconomic status continue to lag behind equal rights.
Sydney Beveridge is the Media and Content Editor for Social Explorer, where she works on the blog, curriculum materials, how-to-videos, social media outreach, presentations and strategic planning. She is a graduate of Swarthmore College and the Columbia University Graduate School of Journalism. A version of this article originally appeared on the Social Explorer blog. You can use Social Explorer’s mapping and reporting tools to investigate dreams, freedoms, and equality further.
Social Explorer is an online research tool designed to provide quick and easy access to current and historical census data and demographic information. The easy-to-use web interface lets users create maps and reports to better illustrate, analyze and understand demography and social change. From research libraries to classrooms to the front page of the New York Times, Social Explorer is helping people engage with society and science.
Subscribe to the OUPblog via email or RSS.
Subscribe to only American history articles on the OUPblog via email or RSS.
Cupid scours a trove of demographic data to guide his arrows. This Valentine’s Day, let Social Explorer help you map your way to love.
Look up information on the 59.7 million available men and 67.4 million available women across the nation (available meaning unmarried, divorced, separated or widowed). These bachelors and bachelorettes can be sorted by age group, geography and more as you develop your demographic dating plan.
Map of 2010 American Community Survey Never Married Population
For instance, Donald Demographics wants to know where the single ladies are. Using the data sorted by city, he can identify where lots of available women dwell. Since he has a thing for women with accents, he can refer to the “Sex By Place Of Birth By Year Of Entry For The Foreign-Born Population” table to help find an international lady.
She also has a thing for arty types, and can keep an eye out for areas with more men in that occupation by consulting the “Sex by Industry” table. More into an outdoorsy crowd? Try areas with larger numbers of men or women in farming, fishing and forestry.
Check out Social Explorer’s maps and reports for more information on dating possibilities in your neighborhood and beyond. It’s the perfect opportunity to try out our custom colors in pink, red and more.
Happy Valentine’s Day from Social Explorer!
Sydney Beveridge is the Media and Content Editor for Social Explorer, where she works on the blog, curriculum materials, how-to-videos, social media outreach, presentations and strategic planning. She is a graduate of Swarthmore College and the Columbia University Graduate School of Journalism.
“We are pleased to release the first annual Illustrator Income Survey; this 88-page book details the incomes of 616 illustrators from all over the world. Easy-to-read charts and graphs detail income information by country, age and gender.”
Recently I’ve been importing the ancient Librarian Avengers archives to live within WordPress. Because the site goes back to…hrm… 1997, there’s some data munging to do.
Right now I’m concerning myself with the period after Graduate School, when I moved to Ithaca, NY for an ostensibly-cool digital library fellowship. I couldn’t talk about how much I hated it at the time so the entries are mostly tangential to the work I was doing, but there’s still some fun stuff.
Importing ancient blog posts involves a bunch of tagging, titling, category-setting, and general modernization. I’ve been progressively making my way through the old posts, adding images, fixing spelling mistakes, and generally adding a bit of polish.
Part of the reason I’m taking on data scrubbing as my One Designated Personal Thing to Do this evening, is that today has been a study in helplessness. My daughter has a (small) fever. It’s the first time she’s been sick, and I’m trying to direct my need to control something (anything!) in a positive direction.
Also, cleaning data is pretty therapeutic after some of the body fluids I’ve encountered recently.
Each year, I rely on CCBC Choices to provide me with statistics about the number of children's books about American Indians and by American Indians published in the previous year. Each year, I add to the table from the previous year. It's not a spiffy-looking graphic, but the info is important!
These statistics represent only quantity, not quality or authenticity. A significant number—well over half—of the books about each broad racial/ethnic grouping are formulaic books offering profiles of various countries around the world. Additionally, the number of books created by authors and illustrators of color does not represent the actual number of individual book creators, as some individuals created two or more books.
What are the 33 books about American Indians? And who are the 12 authors/illustrators (keeping in mind that the number is not 12 different authors or illustrators)? I'll need to do some research to find out what books they received. Reading their website, I see one of the books they received is Joseph Bruchac's Night Wings. I haven't read it yet.
3 Comments on Books by and about American Indians: 2009, last added: 9/28/2010
I'll write to CCBC and ask if they can provide a list.
Using the Comprehensive Children's Literature Database, I searched using "Indians of North America" and got 13 hits:
Black Angels by Linda Beatrice Brown
Rabbit and the Fingerbone Necklace, by Deborah Duvall
Look Both Ways, by Jacquelyn Mitchard
Minnow and Rose: An Oregon Trail Story, by Judy Young
Remember Me, mikwid hamin: Tomah Joseph's gift to Franklin Roosevelt, by Donald Soctomah and Jean Flahive
Lifting the Sky, by Mackie D'Arge
Mudville, by Kurtis Scaletta
The Great Death, by John SMelcer
Crows and Cards: A Novel, by Joseph Helgerson
The Crimson Cap, by Ellen Howard
The Book of Dreams, by O.R. Melling
Night Wings, by Joseph Bruchac
The Runaway Skeleton, by Kathleen M. Muldoon
Of that list, I recognize three books. First is REMEMBER ME: TOMAH JOSEPH'S GIFT TO FRANKLIN ROOSEVELT. I like that book but haven't written about it yet or done any research on it. It's in my to-do pile. Soctomah is Passamaquoddy.
The second is John Smelcer's THE GREAT DEATH. I've written about him before. The clouds around him are so dark that I doubt that I'll read his book. (This has to do with the ways he is constructing his identity, and, the ways he has gone about his research.)
Third is Joseph Bruchac's NIGHT WINGS. I haven't read it.
The other nine books and authors, I do not know...
I noticed that Maddy managed, without trying, while she was in the UK, to run up a $600 phone bill, using data on her phone. Which mostly came from a day when she was stuck in an airport that was closed, and her cousin browsed the web for a bit on Maddy's phone to kill time. T-mobile now charges $16 a meg for data when you're out of the US. To put that in context, according to Vodaphone's site, "On Mobile Broadband 50MB is approximately 100 Emails & 4 Hours browsing", and on T-mobile's rates 100 emails and 4 hours of browsing (running google maps etc) is $800. I asked T-mobile if they didn't have any plans that would work better if you're going abroad and, no they don't.
Which just seems wrong. And, strangely, I was pleased to find this out, as I've got my Nexus 1 and was planning to use it when I travel abroad over the next couple of months, particularly during the middle of March, when I go from the US to New Zealand to the Philippines to Poland to Moscow to the UK... and had Maddy not set off alarm bells, I could, I have no doubt, have come home to a $5,000 phone bill without even trying.
What I'd like is an international SIM card with cheap international data rates: I don't really want to come back from that trip with another 4 SIM cards I'll never use, having lost a morning in each country trying to find a Phone company with a SIm that'll give me data. There has to be someone out there -- and I don't care where they are -- with a decent international data service that covers the world, or enough of it that I don't have to switch it out all the time, and for the kind of rates that don't cost an arm, a leg, a spleen, a different leg, a kidney and both lungs.
Does anyone out there have any suggestions? ("Buy a new Sim everywhere you go" does not count as a suggestion, although it was the most popular thing I heard on Twitter.) Let me know -- and if I find anything good, I'll report back.
The Cooperative Children's Book Center (CCBC) at the University of Wisconsin-Madison publishes CCBC Choices each year. It includes statistical data about numbers of books written by authors of color.
The information I share below is from "Thoughts on Publishing in 2008" by Kathleen T. Horning, Merri V. Lindgren, Tessa Michaelson, and Megan Schliesman. It was originally published in CCBC Choices 2009. I encourage you to become a Friend of the CCBC, which includes a copy of Choices.
In 2008, CCBC received 40 books that featured American Indian themes, topics, or characters. Of those 40, nine were created by American Indian authors and/or illustrators.
Here's two paragraphs from the essay, in the section titled "Multicultural Writing (and Illustrating, Too!)":
Louise Erdrich continued her chronicle of nineteenth-century American Indian experience in The Porcupine Year, which picks up the story of the Ojibwe girl Omakayas, last seen in The Game of Silence (HarperCollins, 2005). Now forced to leave their home, Omakayas’s family is on the move in a story based in part on Erdrich’s own family history. Joseph Bruchac, the most prolific Native author for children and teens, was inspired by family history to research and write what became March Toward the Thunder, about an Abenaki boy serving in the Union army during the Civil War. Nicola Campbell’s picture book Shin-chi’s Canoe looks at Native boarding schools through the a story of a boy enduring his first year away from home.
Horning, Lindgren, Michaelson and Schliesman note that few new picture books that show contemporary children of color were published. They write:
In fact, the only 2008 picture book featuring a contemporary American Indian child that we documented here at the CCBC was Niwechihaw=I Help, a bilingual (Cree/English) book published by Groundwood Books / House of Anansi Press. The Littlest Sled Dog (Orca) features a dog rather than a child or children but does offer a glimpse of a contemporary Inuit village. And The Drum Calls Softly (Red Deer Press) is a bilingual (Cree/English) picture book in the voice of a child who might be contemporary or from the past, although the stunning illustrations by Native artist Jim Poitras (Cree, Salteaux, and Métis) have a historical sensibility.
On October 24, 2008, I posted a table of data from CCBC specific to books by and about American Indians. It covered 2002 through 2007. I'm reposting that table here, adding 2008 statistics to the table.
The Guardian has a long article about what the mechanisms are that keep local library catalogs form being effectively spidered and Googleable. They dip into the complicated area that is policies around record-sharing and talk about OCLCs changed policy concerning WorldCat data. This policy, if you’ve been keeping close track, was slated to be effective in February and, thanks in no small part to the groundswell of opposition, is currently being delayed until at least third quarter 2009.
3 Comments on why you can’t google a library book, last added: 1/30/2009
The January 22 Guardian has an interesting article called “Why you can’t find a library book in your search engine: Finding a book at your local library should just involve a simple web search. But thanks to a US cataloguing site, that is f…
Lee said, on 1/22/2009 3:09:00 PM
What has happened to RDA? I did a significant amount of study on RDA while in library school. Yet it seems to have vanished. Among the many goals of RDA was to make library catalogs google-able (or at least available on the open internet in some fashion).
Peggy said, on 1/30/2009 9:35:00 AM
FYI, Guardian made an online ‘amendment’ to this article on January 30th.
Michael Stephens has a great post describing his Ten Trends & Technologies for 2009, and normally I wouldn’t even point to it because it’s getting a lot of link love elsewhere. If by some miracle you haven’t seen it yet, go read the whole thing, but I want to expand on one particular piece, cloud computing, because librarians need to also discuss the flip side of the benefits that Michael describes. As he notes, Michael isn’t the first librarian to talk about cloud computing, but I haven’t seen as much discussion of the potential consequences of it, especially during the transition we’re in right now where we can’t totally trust the cloud.
Here’s the part of Michael’s post that jumped out at me.
“As regular folks store more data and rely more and more on the cloud, librarians would be well-served to spend some time pondering what this means for services and access. As movies and music become downloads from the great jukebox in the sky, what happens to the AV department? As documents and data find their way to the ether, how can we provide a means to use them? Some implications from the “Cloud” post:
* Understand converged devices are everywhere.
* Allow unfettered access to the cloud.
* Understand that the cloud may also be a valuable information resource.
* Utilize the cloud to save time and money.
That last one is important to me. Why can’t we use Google Docs with our users for productivity instead of paying for bloated software suites? Why can’t we show our users how to save to the cloud so they can access their stuff from anywhere?”
I agree with Michael’s points, but I think we have a critical role in helping users with those third and fourth implications. One of the keys to cloud computing right now is synchronization. Very few people I know completely trust their data to the cloud, and they have backups at home or they synchronize across multiple devices so that if one service fails, they haven’t lost everything.
The problem with this approach at this stage is that early adopters know how to do this, but that’s a pretty small percentage of the population. So while we can definitely work with patrons using Google Docs, I think the more important role for libraries right now is to teach users about these types of services, in no small part so that we can help them understand the potential consequences. Because if you teach a patron to use an online documents site and she puts her resume there and something goes wrong with it, that’s a very real data loss for that person.
So we need to teach people a few different things, besides just how to use these tools.
There are multiple options
I worry when I see librarians promoting only Google Docs. I know Michael was using it as just one example, but I’ve seen others sing its praises with no mention that anything else even exists. Sure it’s easy to use and it works really well, but would you feel comfortable promoting only Microsoft Office Live Docs to your patrons? Most librarians I know would be uncomfortable about doing that, because they see Microsoft as being a monopoly interested only its bottom line, but Google isn’t fundamentally different. They’re actually selling ads with their services, and their ultimate motivation is revenue - never forget that.
How to synchronize or backup those files
Although this will change over the next few years, a very small percentage of the population has a smartphone, and even fewer actually use it to synchronize content to the cloud. A lot of people know about and use flash drives now that prices on them have dropped and storage size has gone up, but I’ve met enough folks who think putting something on the internet means it’s permanent that I strongly believe we need to help teach our users this isn’t true. So if we teach how to use cloud tools, we need to teach that there can also be consequences.
Last year I had a discussion with Eli Neiburger during which he made the interesting point that kids today experience their first data loss at a much younger age than we ever did. That really made me stop and think for a minute about just how much we aren’t teaching our children about technology, and this is an area where we can help both kids and adults, if we recognize this and incorporate it into our media fluency role.
How to think about privacy in this context
What does it mean to put your resume on Google Docs? I’m not sure we’ve really thought through that question. If you use Gmail (so Google is serving up ads based on your messages), the Google search engine (so the big G knows what you’re searching and is showing you ads based on that), your calendar is in gCal, and you use gTalk (just to name a few Google services), that means Google has assembled a pretty good picture of you. How comfortable would you be if all of that data resided with Microsoft? Yahoo? The government? Your ISP? Your employer? A company like Fox that’s owned by Rupert Murdoch?
This is important stuff, because these companies change their policies at the drop of a hat, and users have no say. For example, if you’re an iTunes customer who paid to upgrade your DRM-restricted music to “unrestricted” MP3s last week, this week we found out that those “unrestricted” and “open” files from Apple contain personal information about you. You can now be easily identified by that file, so if it lives in the cloud and something happens to it (like someone steals a copy and puts it on the open web), are you liable for that copyright violation? Granted, the chances of that happening are pretty slim, but how many users are even thinking about this? What does it mean to have personally-identifiable information embedded in data files and living in the cloud? We tend to think this stuff is just secure out there and that these kinds of things won’t happen to us, but it’s only hindsight that is 20/20. What if other companies started embedding personal information about you in files - what would your recourse be? And when it’s a free service, you don’t have a contract or service agreement to fall back on when problems arise.
I don’t consider myself a conspiracy theorist or even particularly paranoid, but this is one reason I don’t use Gmail very much. If you’re reading this, you likely already know all of this is an issue, and you have the capacity to make that decision for yourself. But a large percentage of your users probably don’t.
Teaching critical skills about the cloud will become just as essential as teaching how to evaluate a website, even more so as products continue the march to becoming services. The ease and convenience of accessing this stuff via any computer, including a cellphone, is pushing people to do things they would never do in the “physical” world. Imagine trusting someone you don’t know knocking on your door and saying they’ll take good care of your private data and access to your computer. “Trust me.” Seriously?
I take advantage of some of these services, too, so I’m just as guilty, but I’ve become far less trusting of synchronizing whole folders to the cloud, and I’m more careful about what lives there. I’ll probably start password-protecting more files, too. It’s not a perfect solution, but I’m starting to think more about this stuff and wonder how I can install my own synchronization service, rather than relying on a third party. I’m in the minority, though, and it’s time we recognize as a profession that when we identify these types of trends, it’s not just for our own benefit. We should see this for what it is - an expansion of our traditional role to teach people how to use information well, and we should lead, not just with good models, but with help understanding and dealing with the ramifications of all of this.
Okay, I really intended to try to write up some book reviews today (it's been a long time, have you noticed?) -- but that may have to wait until next week, as time is of the essence as usual. But I can't resist pulling this data from today's Shelf Awareness:
Bookstore sales in November were $1.186 billion, up 7.5% from $1.103 billion in sales in November 2006, according to preliminary estimates from the U.S. Census Bureau. For the year to date, bookstore sales have been $14.654 billion, up 0.8% from $14.532 billion in the first 11 months of 2006. This marks the fifth month in a row that bookstore sales were up over the same period last year--and the second month in a row that year-to-date sales have topped last year's comparable figures.
Okay, it's a small increase, and a short-term trend. But it does seem to me to challenge the idea that things are just eternally spiraling downward for the book industry, and especially for bookstores. Note that "under Census Bureau definitions, bookstore sales are of new books and do not include "electronic home shopping, mail-order, or direct sale" or used book sales." So this is just brick and mortar stores, with sales this year better than the year before. Hooray!
Friday I'm in Poughkeepsie at BookStream (and keep an eye out for some cool announcements from there soon!) I'll be back with some book reviews on Monday. Happy reading!
0 Comments on Data: Happy Days Are Here Again! as of 1/1/1900
I’ve been chitchatting with Simon as he’s been compiling and data-cleaning his set of LoC authority records. He’s at ALA now, and the data has been released into the wild. There’s something that warms my little librarian heart getting to read raw MARC on my own little laptop. Try it yourself!


 Cupid scours a trove of demographic data to guide his arrows. This Valentine’s Day, let Social Explorer help you map your way to love.
 For instance, Donald Demographics wants to know where the single ladies are. Using the data sorted by city, he can identify where lots of available women dwell. Since he has a thing for women with accents, he can refer to the
  Sydney Beveridge is the Media and Content Editor for Social Explorer, where she works on the blog, curriculum materials, how-to-videos, social media outreach, presentations and strategic planning. She is a graduate of Swarthmore College and the Columbia University Graduate School of Journalism.


I love the Weirdworld comic. I was never a fan of the main character, nor am I too into the whole Secret Wars thing going on, but the art is fantastic and weird and I love it.
I really want to read it: Arkon has been such a jerk, I’m interested to see what was made of him. And of course, I wanna know the terrilbe fate of the Crystal warriors! I’m a huge fans of Saga of Crystar.
What happened in Ant-Man #5 that made it jump so far in sales?
It looks like a special crate/box offer, or a special variant program at the same time than the release of the movie (like “buy 50 of those to 1 special variant cover for this”) but it had clearly nothing to do with readers taking a sudden interest into reading it.
Hi Xavier! Great column, as usual. The phenominon that is Star Wars sales are outrageous. How would Marvel stack up against DC if they didn’t have the numbers from the Star Wrs titles?
Thanks for the response, Xavier.
I do think the Star Wars books are sort of proof that a stable creative team can do a lot for a book/line of books. Darth Vader’s had a stable team, and while Cassaday didn’t stick around on the main book, I’m confident Immonen can deliver on a monthly basis. Sorta like Snyder/Capullo on Batman.
Why in the world would someone pay $25 dollars for a trade that they could have bought for $18 in floppies?!
THOR HC VOL.2 – 2,562 | 136p, $25
Only two months after the release of volume 1, here is volume 2, at a not-very-friendly price, and collecting very few things (only issue 6-8 and Annual 1). Sales are ok but its less than the first volume. Apparently, reviewers were not really happy with the small amount of stories collected.
I mean, there is value in a trade that floppies don’t have (ease of display, ease of re-read, no ads), but also factor in that it’s easier to pay non-cover price for a trade. Amazon marks stuff down on the regular. But I agree, a bit lower a price would be preferable.
Remind yourself that it’s a HC: they are always way more expensive than their floppy counterpart.